Key Takeaways:
- U.S. Ethereum spot ETFs posted inflows, snapping a 13-day streak of outflows.
- Increased trading volume and a price bump suggest renewed investor interest.
- Here are some technical indicators suggesting a potential bullish trend for Ethereum.
After months of market tension, Ethereum (ETH) is providing investors with a glimmer of hope. Earlier this week, the cryptocurrency ended a concerning 13-day streak of outflows from U.S. spot Exchange Traded Funds (ETFs), prompting speculation of a potential turnaround in market sentiment.
Table of Contents
A Changing Tide: From Capital Outflow to Inflow
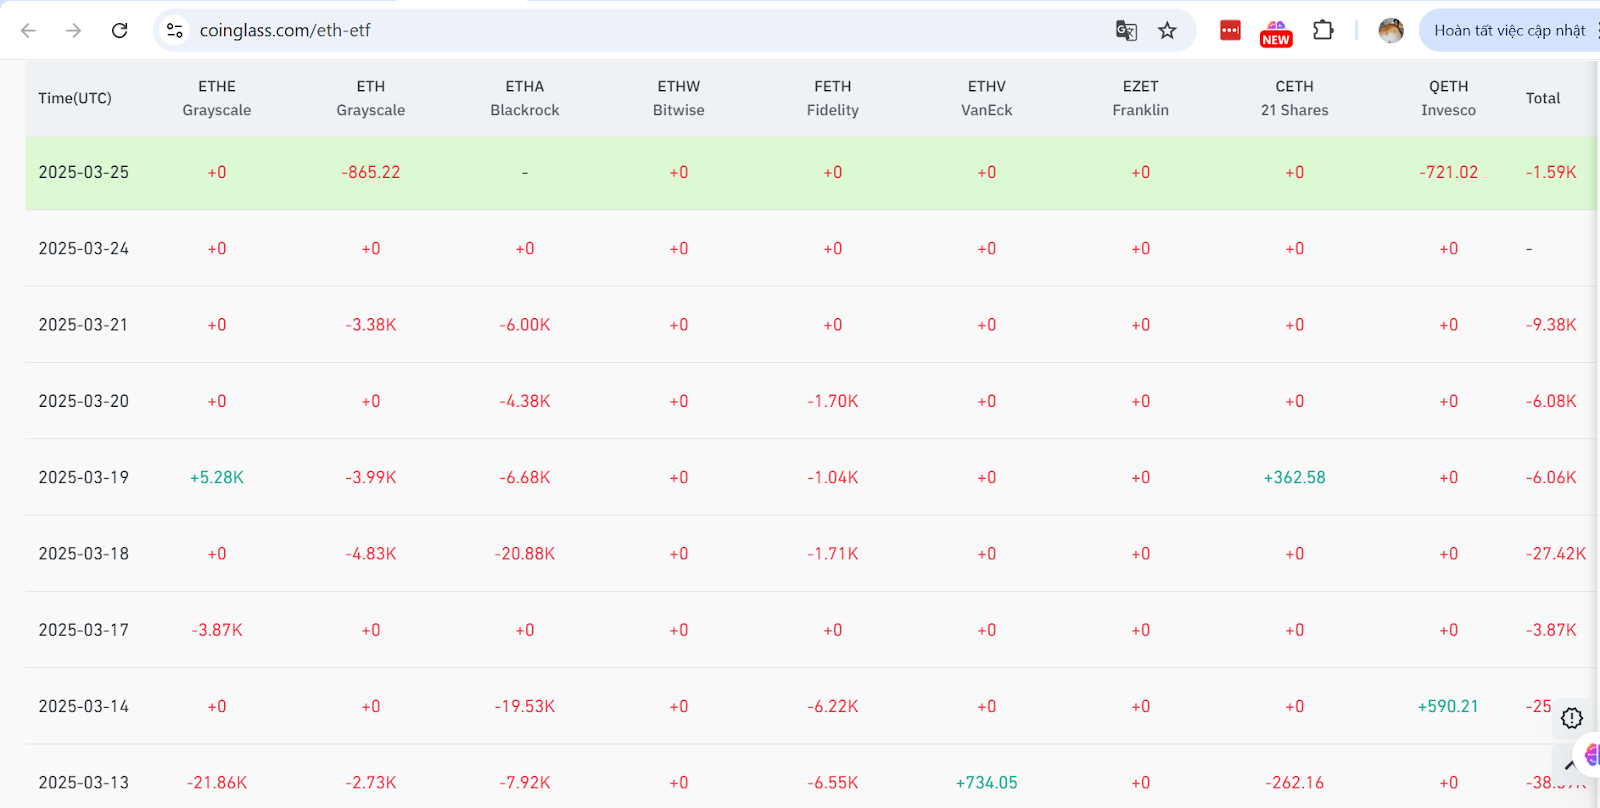
U.S. spot Ethereum ETFs experienced continuous outflows for almost two weeks, indicating a lack of investor confidence. But that all changed on March 25, 2025, according to Crypto Rover. There was a $3.2 million inflow, reversing the $12.5 million outflow recorded 24 hours earlier. Such a reversal could signal to the market that institutional investors are once again seeking value in Ethereum.
Notably, during the week ending March 21, Ethereum funds experienced a net outflow of $102.9 million, with BlackRock’s iShares Ethereum Trust ETF (ETHA) representing $74 million of that total.
Positive Reactions of Price and Volume
This reversal in ETF flow coincided with ETH’s price movement. The price surged from $3,200 to $3,250, which is about a 1.56% rise. As prices grew, both Binance and Coinbase reported increased ETH trading volume. The trading volume within 24 hours rose from 2.2 million ETH to 2.5 million ETH, while Coinbase’s volume reached an increase from 1.8 million ETH to 2.1 million ETH. This spike in trade volume is also a sign of more participation in the market and renewed interest in Ethereum.
On the 17th, for instance, as revealed by TradingView, the ETH/USD trading pair saw increased volatility, with the price rapidly shifting from $3,250 to $3,270 in the span of one hour.
Main Technical Indicators Signal Upward Momentum
Aside from the direct price response, there was potentially something promising to see on the charts for Ethereum. The RSI (Relative Strength Index) was at 68, indicating that ETH was moving towards overbought territory and remained under strong buying pressure. Additionally, there was a bullish crossover in Moving Average Convergence Divergence (MACD), suggesting bullish momentum. Both the 50-day and 200-day moving averages sit below Ethereum’s price, adding support for a potential uptrend. Ethereum also fared well on-chain in terms of encouraging metrics, as the number of active addresses rose signifying increased network activity.
Ethereum: Perspective While Many Have Doubt
Ethereum has faced some criticism lately, and so the news of the inflow comes at a time when Ethereum is a hot topic. In fact, Standard Chartered recently slashed its year-end price target for Ether by 60% to $4,000, citing Ethereum’s growing dependence on layer-2 scaling solutions as a reason why the blockchain may not maintain its historical dominance in the blockchain ecosystem. Even so, institutional interest in Ethereum is still there, as evidenced by BlackRock’s BUIDL fund, which controls a large amount of Ether.
Analysts remain cautious, however, noting economic headwinds lying in wait, including new tariffs, that could bring downward pressure. Traders need to stay on their toes and adjust the risk appropriately. The market is still skittish about broader economic events, and a recovery that appears to be taking shape can quickly come undone. Recent developments highlight the volatility of cryptocurrency markets.