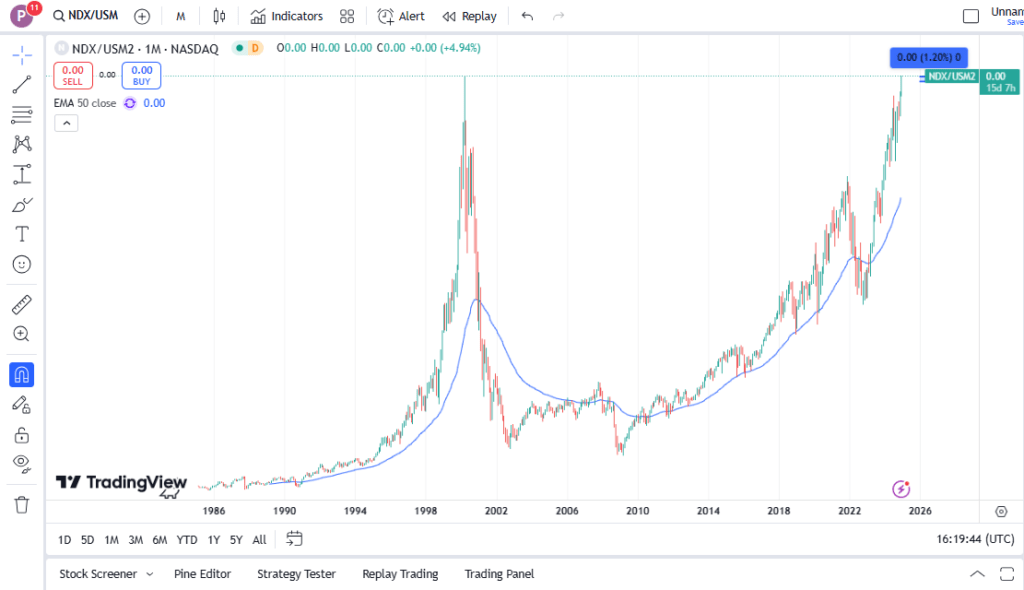
The ratio of NASDAQ to U.S. M2 Money Supply (NASDAQ/U.S. M2 Money Supply) warrants close scrutiny as it has surpassed the peak seen in March 2000 during the dotcom bubble. Monitoring this ratio helps remove the effects of inflation, allowing for a more accurate assessment of the real growth of NASDAQ, independent of currency devaluation.
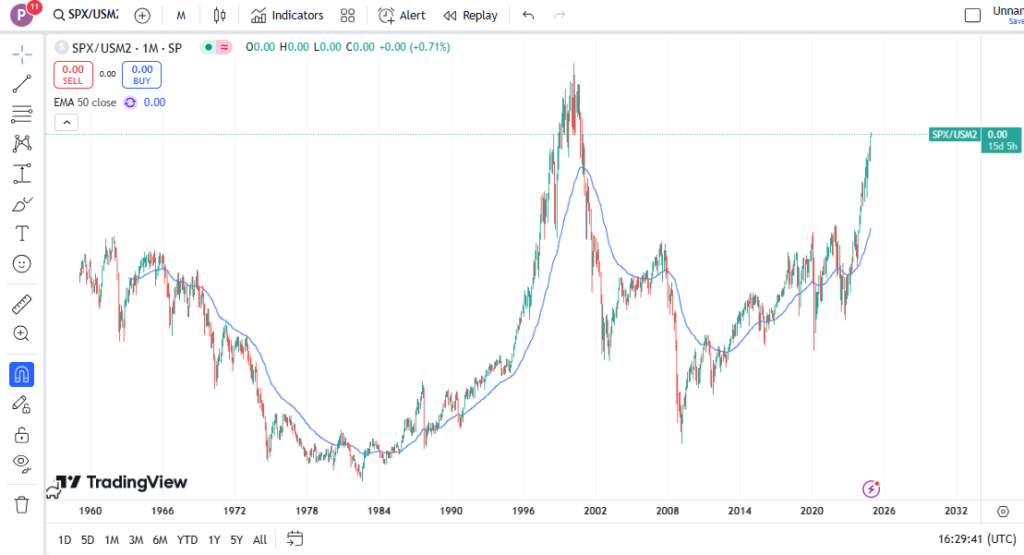
Similarly, the S&P 500/M2 Money Supply ratio is approaching its 2000 peak, only needing a small increase to reach it. However, when combined with record-high P/E and P/B ratios, rising unemployment rates, and other market signals, investors should exercise extreme caution.
Table of Contents
1. Definition: What Is the NASDAQ / U.S. M2 Money Supply Ratio?
The NASDAQ / U.S. M2 Money Supply ratio compares the value of the NASDAQ index to the U.S. M2 money supply. Specifically:
- NASDAQ: Represents technology and high-growth companies listed on the Nasdaq stock exchange in the U.S.
- M2 Money Supply: A broad measure of money circulating in the economy, including cash, checking deposits, and easily convertible savings deposits.
Dividing the NASDAQ index by the M2 Money Supply removes the inflation factor, reflecting the actual growth of companies rather than merely currency depreciation. This ratio helps investors evaluate whether the stock market is overinflated compared to the real money circulating in the economy.
2. Why Analyze the NASDAQ / U.S. M2 Money Supply Ratio?
Many investors focus solely on stock indices like NASDAQ or S&P 500. However, this perspective can overlook inflation and currency devaluation. NASDAQ’s increase may not reflect genuine market strength but could result from USD devaluation. Therefore, dividing NASDAQ by the U.S. M2 Money Supply is essential to assess the market’s real value and identify whether NASDAQ is in a buying or selling zone.
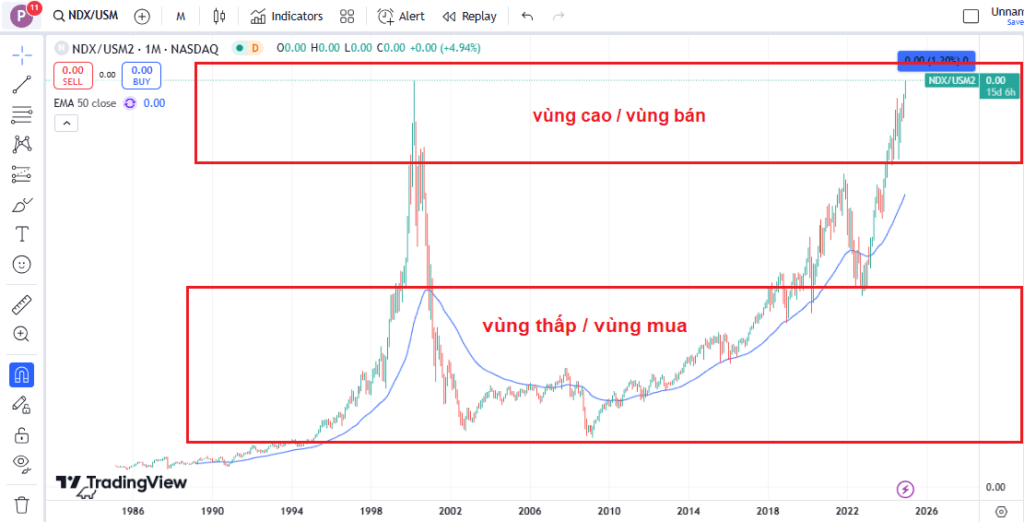
This ratio eliminates the influence of expanding money supply, serving as a critical tool to determine whether the market’s growth is real or simply driven by liquidity.
3. NASDAQ and NASDAQ / U.S. M2 Money Supply Hit New Highs
Considering the importance of the NASDAQ/M2 Money Supply ratio, let’s examine the current state of NASDAQ. Recently, NASDAQ surpassed 20,100 points—more than 3.3 times its March 2000 dotcom bubble peak of ~5,048 points.
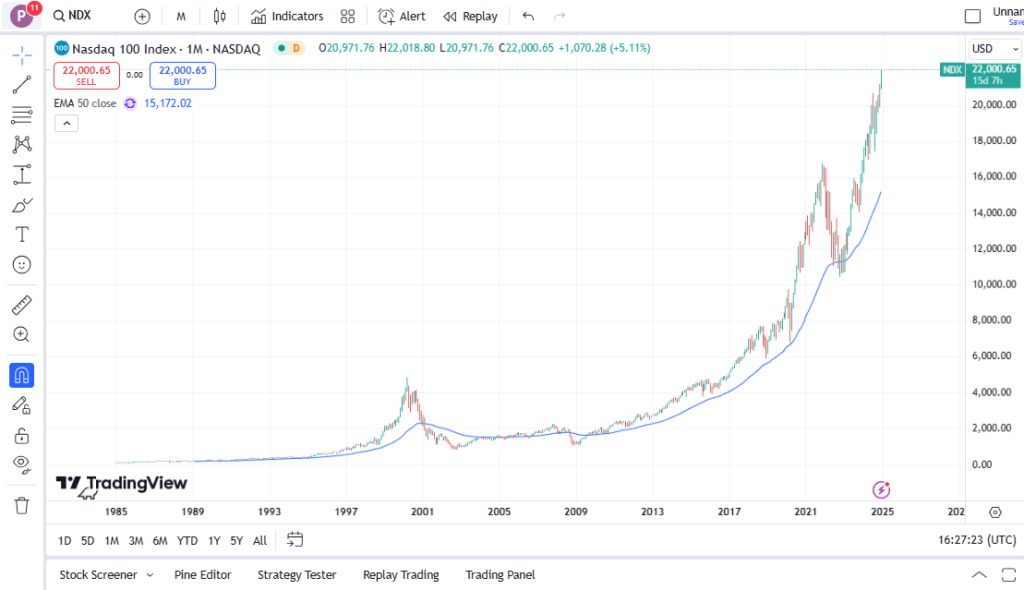
More concerningly, the NASDAQ/M2 Money Supply ratio has also exceeded its 2000 peak, indicating that the market is not only experiencing nominal price growth but is also reaching extreme valuation levels compared to real money flows.

If NASDAQ is priced far above the dotcom bubble peak, what is the situation with the S&P 500? Let’s analyze it similarly.
4. The State of S&P 500 / M2 Money Supply
If NASDAQ/M2 Money Supply has exceeded its peak, the S&P 500’s situation is also worrisome. The S&P 500/M2 Money Supply ratio is close to its 2000 dotcom peak, requiring only a 16.5% increase to reach its highest level. This highlights further concerns that the market is at extreme valuations.
Understanding historical market bubbles offers insights into potential risks in today’s environment.
5. Historical Bubbles and Repetition
Looking at past financial bubbles helps contextualize the risks of current high valuations:
- Dotcom Bubble (2000): Fueled by excessive optimism around internet technology.
- Global Financial Crisis (2008): Triggered by the housing market and financial derivatives.
These cycles share a common trait: stock values were driven far above their fundamentals, ultimately collapsing. With NASDAQ/M2 and S&P 500/M2 now reaching or nearing 2000 bubble levels, history suggests caution.
Adding to this, current valuation metrics such as P/E and P/B ratios point to an overheated market.
6. Additional Factors: Record-High P/E and P/B Ratios
Market valuations are alarming, with key metrics at record highs:
- The current P/E ratio of the S&P 500 is 31, a concerning figure.

- The P/E ratio of the NASDAQ is even higher, reaching 49, which is three times the level considered reasonable (around 15 to 20).

- The current P/B ratio of the S&P 500 is 5.33, significantly higher than the typical buying range of 2 to 3.
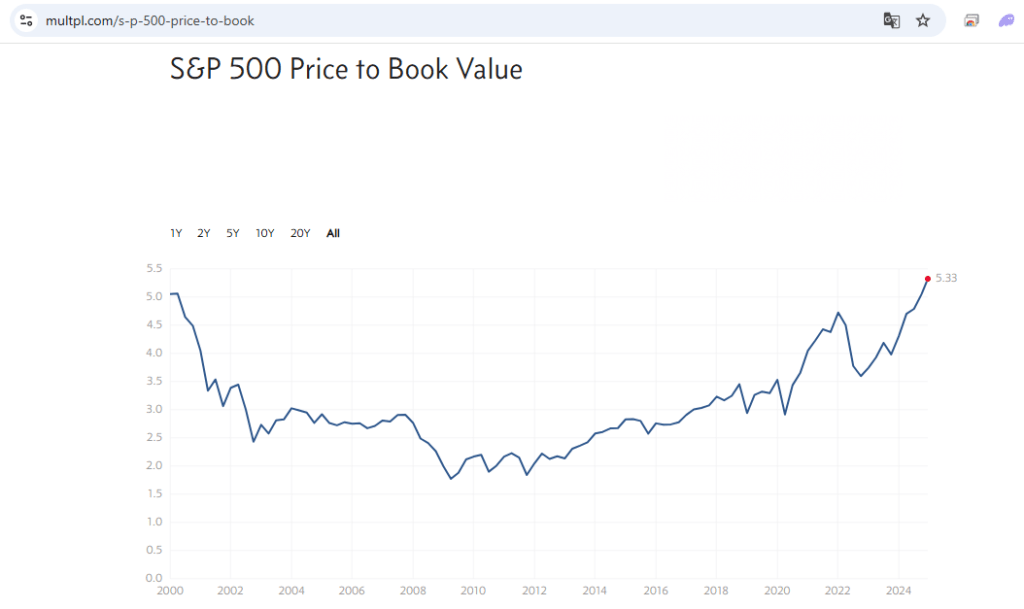
- The P/B ratio of the NASDAQ is currently 4.19, also much higher than the average buying range (2010–2014), which was between 0.8 and 1.0.

These figures reinforce concerns that the market is overvalued and possibly entering a bubble.
Economic indicators such as unemployment and the yield curve add to these risks.
7. Economic Signals: Unemployment and Yield Curve Inversion
Two key macroeconomic indicators are raising alarms:
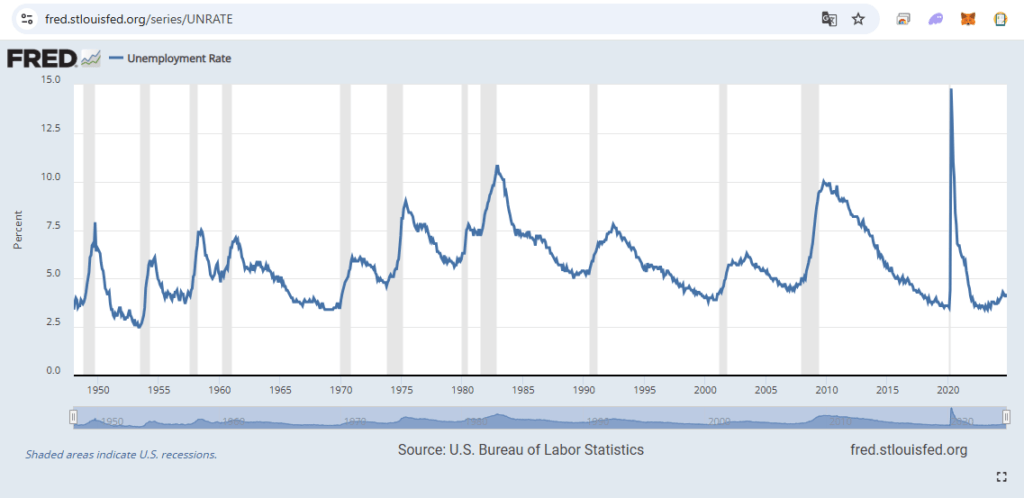
- Rising Unemployment: Historically, rising unemployment precedes major economic recessions.
- Yield Curve Inversion: The yield curve recently inverted and is now steepening—a classic signal of impending recessions.
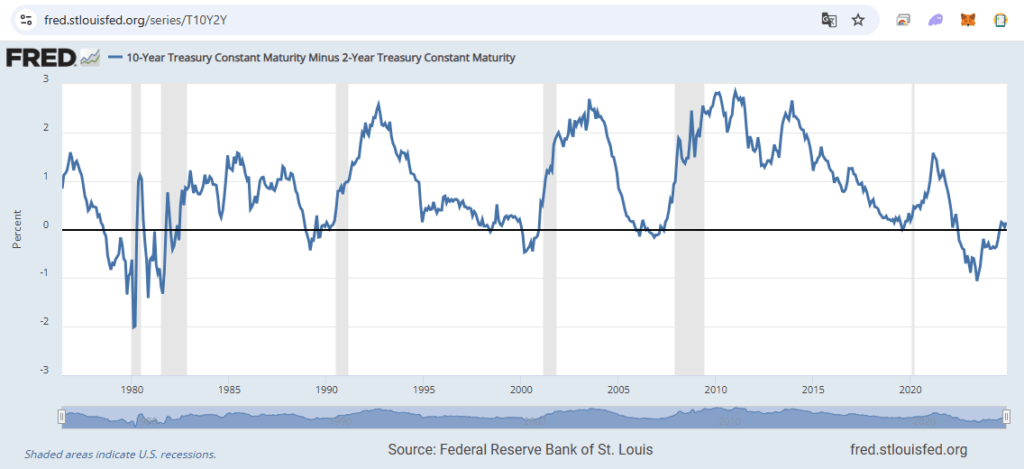
Together with high valuations, these signals increase the likelihood of a significant market correction.
8. Warren Buffett’s Moves: Selling Stocks and Holding Cash
Legendary investor Warren Buffett has been selling stocks for seven consecutive quarters, holding record levels of cash. His actions reflect caution about the current market. Buffett’s philosophy of being “fearful when others are greedy” serves as a warning against excessive optimism.
Investors should also reconsider expectations around interest rate cuts.
9. Interest Rate Cuts Do Not Guarantee Market Growth
Some investors hope that Federal Reserve rate cuts will boost the market. However, history shows otherwise: in 13 out of 20 instances over the past 200 years, rate cuts preceded stock market declines, as they often respond to worsening economic conditions.
This underscores the need for cautious optimism amid current risks.
10. Global Impacts if S&P 500 and NASDAQ Crash
A sharp correction in U.S. markets would have global repercussions:
- VN-Index (Vietnam): Vulnerable due to reliance on foreign capital.
- ASX 200 (Australia): Moves in tandem with major markets like the S&P 500.
- Bitcoin: Despite being considered uncorrelated, Bitcoin often follows liquidity trends in equities.
A U.S. market crash would ripple across financial systems worldwide.
11. Strategies for Investors
Given heightened risks, investors should adopt defensive strategies:
- Exercise caution in the next 1-2 years: Defensive strategies should be adopted during this period, and investment allocations should be reduced. Avoid rushing to buy the dip when the market has only undergone a short-term correction, as many investors have done in the past to achieve profits. This time, things might be different, as the valuation of the U.S. stock market is currently excessively high.
- Exercise Caution: Reduce portfolio exposure and avoid catching falling knives during brief corrections.
- Diversify: Invest in non-correlated assets like gold, bonds, or defensive ETFs.
- Reduce Exposure to Overvalued Stocks: Sell or trim holdings in stocks with high P/E and P/B ratios.
- Hold Liquidity: Maintain higher cash reserves to capitalize on future opportunities.
- Monitor Economic Cycles: Align investments with broader economic indicators.
Conclusion
The U.S. stock market is at extreme valuations, echoing the dotcom bubble of 2000. Combined with macroeconomic signals such as unemployment and yield curve inversion, the risk of a market downturn is growing. While timing remains uncertain, risk mitigation is essential.
Rather than being swayed by greed, investors should focus on long-term strategies, emphasizing diversification and value-based investing. Thoughtful decisions today will lay the foundation for safety and sustainable growth in the future.

